グラフの空きスペースに拡大図を描きたくて色々調べていたところ、gnuplotのmultiplot機能を使って拡大図を描けることが分かりました。(考えてみれば当たり前なのですが、、、)
multiplotの使い方を調べるといくつかのグラフを並べて描くのに用いるのが一般的なようで、あまり日本語で説明してくれているサイトがなかったので今後のためにメモ。。
スクリプト例
#####
## まずmultiplot機能を開始
set multiplot
unset key
set xrange [-6:8]
set yrange [-200:200]
## 拡大範囲を強調したいので長方形を配置
set object 10 rect from graph 0.5714,0.5375 to graph 0.714,0.5625 fs empty border rgb "black" lw 2
plot -x**3 + 4*x**2 + 7*x - 10, 20.7453 w l dt "-" lc 3, "line1.dat" w l lc rgb "black", "line2.dat" w l lc rgb "black"
## 二つ目のグラフの調整
## 位置と大きさ指定
set origin 0.2, 0.12
set size 0.35, 0.35
clear
unset xlabel
unset ylabel
set xrange [2:4]
set yrange [15:25]
unset object
## 一つ目のグラフに被らないように上下左右の余白を消す
set lmargin 0
set tmargin 0
set rmargin 0
set bmargin 0
set label 1 at graph 0.6, 0.5 "peak" font "Arial, 18"
set label 2 at graph 0.6, 0.65 "(3.361, 20.745)"
plot -x**3 + 4*x**2 + 7*x - 10, 20.7453 w l dt "-" lc 3, "peak.dat" ps 2 pt 7 lc 2
set nomultiplot
#####
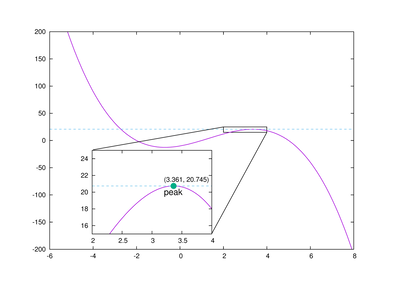
と、こんな感じのグラフができます。